
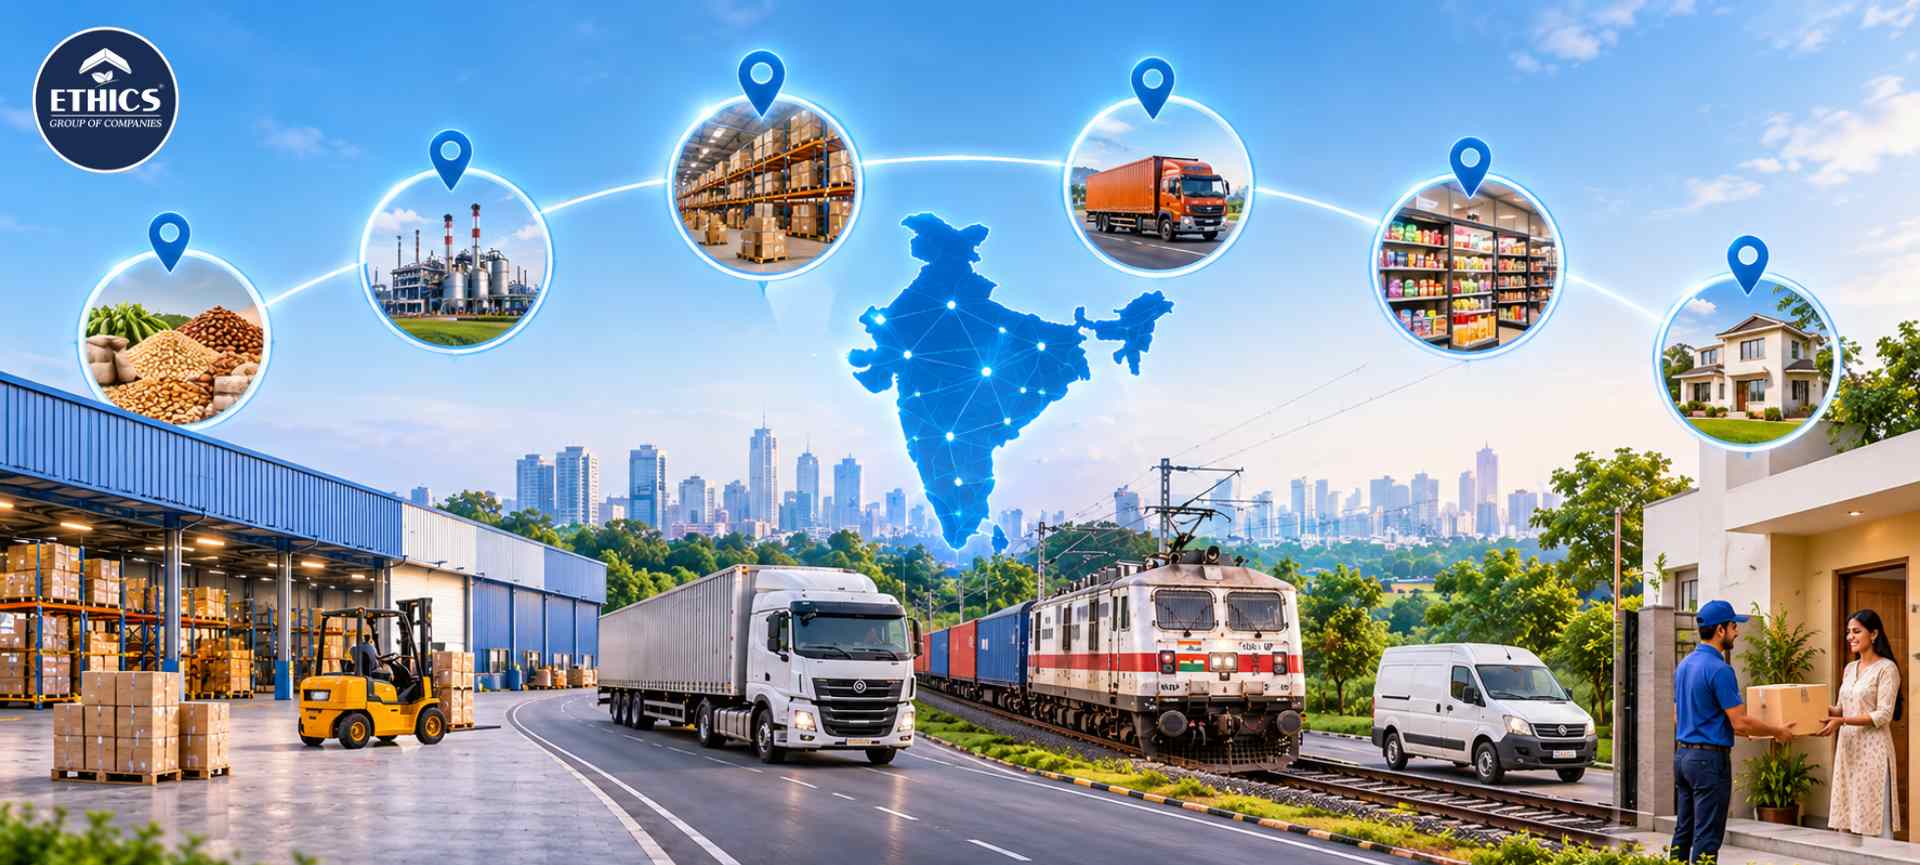
Ask five managers in the same company to draw their supply chain and you will get five different diagrams. Procurement draws suppliers. Operations draws plants. Sales draws customers. Nobody draws the whole thing, and that is where cost and delay hide.
Supply chain management starts with a shared picture. This guide walks through mapping from sourcing to last-mile in seven steps. It covers what to capture at each stage, what data you need and how to turn the finished map into decisions.
What Is Supply Chain Mapping and Why Does It Matter?
Supply chain mapping documents every node, flow and handoff from raw material supplier to final customer. Each node carries its data: lead times, volumes, costs, risks and owners.
A good map shows three flows together: physical goods, information and cash. A process flowchart rarely does.
It also helps to be clear on supply chain vs logistics. Logistics covers movement and storage. The supply chain also includes planning, sourcing, production and payment terms. A map that shows only trucks and warehouses misses half the picture.
Why it matters: most supply chain challenges trace back to blind spots. These include a single-source supplier, a transit leg nobody owns, or a depot holding six weeks of stock for an item that sells in two.
Finance feels this too. Without a map, you cannot reliably calculate landed cost, cash-to-cash cycle or cost-to-serve by channel.
Before You Start: Scope, Data and Tools
Scope narrowly. Map one product family or customer segment first. A single end to end supply chain, mapped properly, teaches more than a whole-business diagram drawn at high level.
Define the outcome. Are you cutting lead time, cost-to-serve, inventory or risk? The goal decides the detail you need.
Gather the data:
-
Supplier lists, bills of material and purchase orders
-
Goods receipt and inventory data by location
-
Production lead times and yields
-
Freight invoices and delivery performance
-
Returns, claims and customer complaints
Choose tools proportionately. Start with workshops and a spreadsheet or whiteboard. Move to network-modelling software only after the baseline is agreed.
Involve the right people. Procurement, plant, warehouse, transport, sales and finance should all be in the room. Then walk the floor. The documented flow and the actual flow are rarely the same.
Steps 1–3: Mapping the Upstream (Sourcing, Inbound and Production)
Many teams call this the first mile. Here, you map how materials reach and move through your production.
Step 1: Sourcing
List suppliers by tier, location, spend, lead time and substitutability. Flag single-source items and look one tier deeper for critical inputs.
This matters especially in pharma logistics in India, where many manufacturers rely on imported active ingredients and excipients. Tier-2 visibility there can decide whether a batch ships on time.
Step 2: Inbound Logistics
Capture the mode, carrier, port, customs clearance time, dwell and transit variability for each inbound lane. Record Incoterms, duty and payment terms.
From these you build true landed cost, which is often very different from the purchase price.
Step 3: Production
Map plant locations, capacity, changeover times, batch sizes, work-in-progress and yield. Mark where buffer stock sits and why.
Note how demand forecasts feed production plans. Poor forecasts show up here first, as schedule changes and expediting.
Steps 4–5: Mapping the Midstream (Warehousing, Inventory and Transport)
This is where goods wait and move, and where most hidden cost accumulates.
Step 4: Warehousing and Inventory
List every storage node: plant warehouses, central and regional hubs and depots. For each, record ownership, size, facility grade and capability, and inventory days.
Check what runs each site. A warehouse management system gives location-level accuracy. Spreadsheets give you estimates. That difference decides how much you can trust the rest of the map.
Flag ageing stock, slow movers and duplicate safety stock held at several nodes. Finance should attach carrying cost, which covers capital, storage, insurance, shrinkage and obsolescence.
Step 5: Transport
Map each lane by origin, destination, mode, carrier, frequency, load factor, transit time and cost per tonne-kilometre.
Mark every mode change. In multimodal freight transport, each transfer from road to rail to sea is a risk point for dwell, handling damage and documentation errors. Include e-way bill and other compliance steps so that nothing sits unseen.
Steps 6–7: Mapping the Downstream (Distribution and Last Mile)
Step 6: Distribution
Map secondary distribution from depots to distributors, wholesalers, modern trade and quick-commerce dark stores. Do it by channel, because each channel behaves differently.
In an FMCG supply chain, channel mix drives order size, delivery windows and cost-to-serve. A product that looks profitable on average can lose money in a particular channel.
Include distributor inventory and credit terms. They affect your cash cycle even when the stock sits on someone else’s shelf.
Step 7: Last Mile
Capture delivery success rate, failed attempts, cost per drop, proof-of-delivery turnaround and returns. In B2B, include retailer slot compliance, unloading time and installation.
Compare the customer promise with actual performance. The gap is the starting point for improvement.
Turning Your Supply Chain Map Into Action
A finished map is a diagnostic, not a deliverable. Use it to find and fix hotspots.
|
Stage |
What to measure |
Typical gap to look for |
|
Sourcing |
Supplier concentration, lead time |
Single-source and tier-2 blind spots |
|
Inbound |
Landed cost, dwell time |
Port and customs delays, hidden duties |
|
Production |
Yield, changeover, WIP |
Expediting caused by forecast errors |
|
Warehousing |
Inventory days, accuracy |
Duplicate buffers, ageing stock |
|
Transport |
Cost per tonne-km, transit variability |
Empty legs, poor load factor |
|
Distribution |
Cost-to-serve by channel |
Loss-making channels hidden by averages |
|
Last mile |
Delivery success, cost per drop |
Failed deliveries, slow proof of delivery |
Then follow this sequence:
-
Rank hotspots in rupees. Estimate the impact on working capital, cost-to-serve or lost sales.
-
Add supply chain visibility where it matters most. Track high-risk or high-value lanes first rather than everything at once.
-
Assign owners. Every hotspot needs a named person and a date.
-
Pilot fixes. Test changes on one lane or one channel before scaling.
-
Refresh the map. Review it quarterly and after any network change.
In 2026, many businesses are feeding mapped data into control towers and scenario models. Those tools are only as good as the map beneath them.
Conclusion
Mapping from sourcing to last-mile is not an academic exercise. It gives operations, finance and sales a single version of the truth, and it turns vague frustration into prioritised, costed action.
Start small, validate on the ground and refresh regularly. Ethics Group helps businesses map and optimise their networks so that every handoff, from supplier to customer, is visible and accountable.





.jpg)