
Most operations reviews fail in the same way. Dashboards carry dozens of metrics, nobody agrees on the definitions, and the CFO still asks a simple question: are we serving customers profitably?
Supply chain management improves only when teams measure the right things, consistently. This guide covers 15 supply chain KPIs across service, inventory, warehouse, transport and finance. Each comes with a formula, what it signals and how to put it to work.
Why Tracking Supply Chain KPIs Matters
KPIs turn opinions into evidence. Without them, a late delivery is a complaint. With them, it becomes a pattern you can trace to a lane, a supplier or a planning error.
They also clarify supply chain vs logistics. Logistics KPIs track movement and storage. Supply chain KPIs go further, covering planning accuracy, supplier performance and cash.
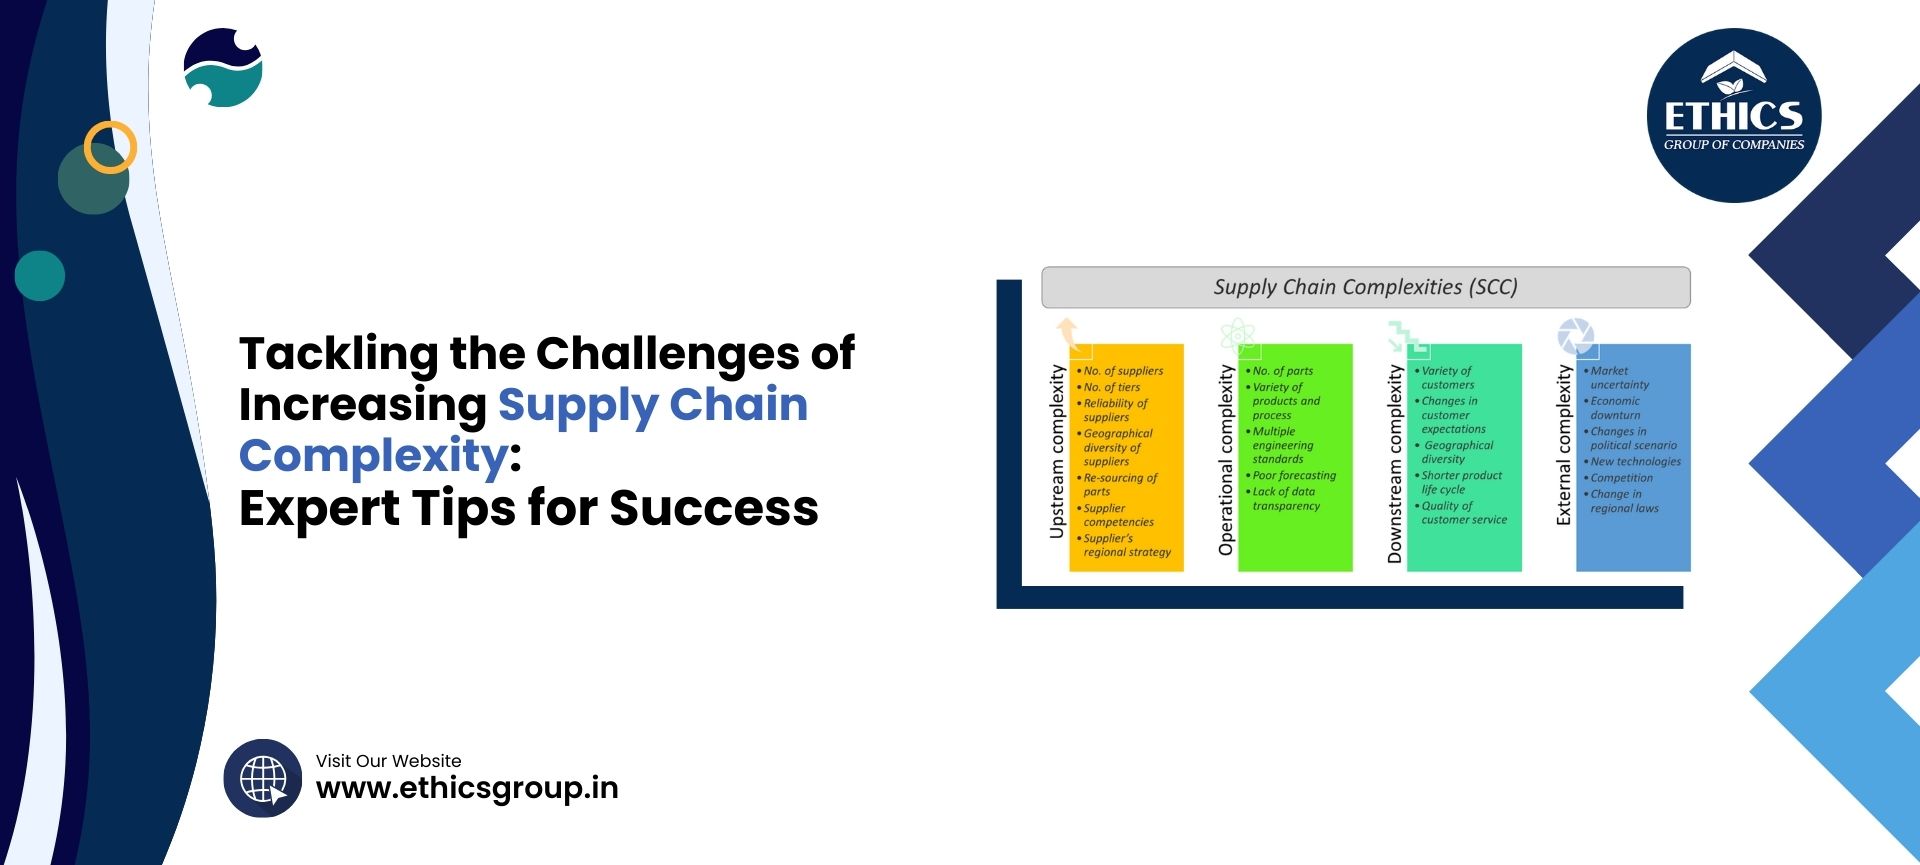
Good metrics expose recurring supply chain challenges, from forecast bias to carrier delays, before they reach revenue. They also give finance and operations a shared language for working capital and cost.
The goal is not to track everything. Pick a balanced set and review it consistently.
Customer and Service KPIs
These show what customers actually experience. Across the network, from sourcing to last-mile, a service promise is only as strong as its weakest handoff.
|
# |
KPI |
Formula |
What it tells you |
|
1 |
On-time in-full (OTIF) |
Orders delivered on time and in full ÷ total orders × 100 |
Delivery reliability; the metric many retailers penalise |
|
2 |
Order fill rate |
Units shipped ÷ units ordered × 100 |
Whether stock availability matches demand |
|
3 |
Perfect order rate |
Orders on time, complete, undamaged and correctly documented ÷ total orders × 100 |
End-to-end quality; any single failure breaks the order |
|
4 |
Order cycle time |
Time from order receipt to delivery |
Speed and process friction |
Define “on time” against the customer’s delivery window, not your dispatch date. Many OTIF disputes start with mismatched definitions.
Inventory and Planning KPIs
|
# |
KPI |
Formula |
What it tells you |
|
5 |
Forecast accuracy and bias |
100% − weighted MAPE; bias = (forecast − actual) ÷ actual |
Planning quality, and whether you consistently over- or under-forecast |
|
6 |
Days of inventory on hand |
(Average inventory value ÷ cost of goods sold) × days in period |
How long cash sits on the shelf |
|
7 |
Stockout rate |
SKU-location instances out of stock ÷ total SKU-locations × 100 |
Missed sales and service risk |
Use weighted MAPE for low-volume SKUs, since simple MAPE can mislead on small numbers. Watch bias closely. A steady over-forecast quietly inflates inventory.
In an FMCG supply chain, track stockouts and days on hand by channel. Promotions and quick-commerce replenishment create very different demand patterns from general trade.
Warehouse and Transport KPIs
A warehouse management system makes most of these measurable at location level. Without one, expect estimates.
|
# |
KPI |
Formula |
What it tells you |
|
8 |
Inventory record accuracy |
Locations where the system matches the physical count ÷ locations counted × 100 |
How far you can trust stock data |
|
9 |
Dock-to-stock time |
Time from truck arrival or unloading to stock available in the system |
Inbound speed and putaway discipline |
|
10 |
Order picking accuracy |
Correct lines picked ÷ total lines picked × 100 |
Errors, returns and rework cost |
|
11 |
Transport cost per tonne-km (or % of sales) |
Freight spend ÷ tonne-km moved |
Freight efficiency; read alongside load factor |
Track transit time and cost by lane and mode, not as a single average. On multimodal freight transport journeys, dwell at each transfer point often explains variance that averages hide.
Supplier and Financial KPIs
These connect operations to the balance sheet.
|
# |
KPI |
Formula |
What it tells you |
|
12 |
Supplier OTIF |
Purchase orders received on time and in full ÷ total purchase orders × 100 |
Upstream reliability |
|
13 |
Cash-to-cash cycle time |
Days inventory + days receivables − days payables |
How fast operations convert to cash |
|
14 |
Total supply chain cost as % of revenue |
Procurement, freight, warehousing and inventory carrying cost ÷ revenue × 100 |
Overall efficiency |
|
15 |
Excess and obsolete stock % |
Value of excess and obsolete inventory ÷ total inventory value × 100 |
Write-off risk |
Finance should own the cost definitions. Agree on what counts as “supply chain cost” so figures stay comparable quarter to quarter.
In pharma logistics in India, supplier lead-time reliability and expiry-driven write-offs deserve extra attention, particularly for imported ingredients and short-dated products.
How to Choose, Track and Improve Your Supply Chain KPIs
Choose
-
Link KPIs to business goals. Decide whether the priority is service, cost or cash.
-
Balance the set. Include at least one service, one inventory, one cost and one cash metric. Optimising one alone often damages another. Cutting freight cost can hurt OTIF.
-
Define each KPI precisely. Write down the formula, data source, owner and review frequency.
Track
-
Fix the data first. Clean master data and timely supply chain visibility feeds make KPIs credible. A metric nobody trusts will not drive action.
-
Review at the right rhythm. Review operational KPIs such as picking accuracy and dock-to-stock weekly or daily. Review financial KPIs such as cash-to-cash monthly.
-
Segment before averaging. Break results down by customer, channel, lane, SKU and supplier. Averages hide problems.
Improve
-
Set targets from your own baseline. Compare against history first, then against peers where credible benchmarks exist.
-
Assign owners and actions. Every red KPI needs a named owner, a root-cause review and a deadline.
-
Connect the scorecard. An end to end supply chain scorecard links supplier, plant, warehouse and customer metrics so teams stop optimising in isolation. In 2026, more businesses are feeding these into control towers with automated alerts.
Conclusion
Supply chain KPIs work when they are few, clearly defined and tied to decisions. Start with a balanced set, fix the data, and review results with the people who can act on them.
Ethics Group works with businesses to build KPI scorecards that connect warehousing, transport and distribution performance to service and cost outcomes.